

-1682341204.jpg)
All Local Authorities have been changing practices over the last few years towards a more risk-based approach to drainage network maintenance, which has increased the need for more data. But what if the very bedrock of your decisions was inaccurate?
As the largest provider of drainage maintenance software to the Local Authority market, KaarbonTech have been striving to help customers work smarter on their journey towards true asset-based management of their drainage networks.
Managing more than 50 networks across the UK highlighted several conflicting opinions about best practice. With so much experience up and down the country, each opinion is invariably supported by case studies and historic working practices. But which is right?
We invited more than 300 industry frontline, strategic and managerial staff to have their say on some critical points. The results were really interesting and show how divided opinion is on some points across the country.
The bedrock of most drainage maintenance decisions in this country.
The silt level measurement in a gully is the number one factor used for risk profiling of maintenance requirements. Many authorities rely on silt level alone to plan future maintenance regimes, so what if the data is unreliable?
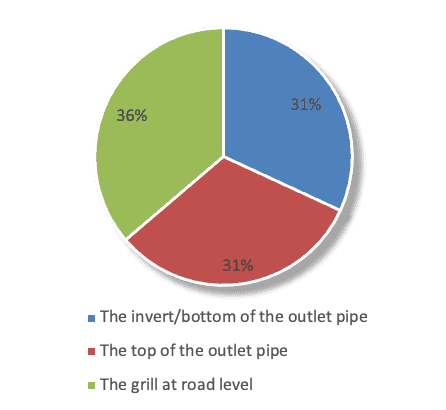
When we asked the fundamental question “At what point is a gully 100% full of silt?” at meetings, we would often receive differing opinions despite the consistency of this measurement being so critical to any successful planning. Some would say the invert level of the pipe, others would say the top of the outlet or the grill at road level. Often opinion around the table would be mixed and we started to realise that this question was rarely clarified amongst the workforce.
The results of the survey showed just how divided opinion was, but the real issue was that those opinions differed within the same Local Authority which could contaminate the very bedrock of your decision making. Larger networks with more cleansing teams appeared more susceptible to this, as having some teams measuring silt in different ways to others contaminates the overall maintenance history.
At what point is a gully 100% full of silt?
 There are several reasons that people feel the level of silt is measured differently.
Gully crews working via a subcontractor and switch between multiple contracts, each with their own scale of measurement, causing confusion.
Management of a measurement scale is not clearly defined so cleansing crews use their initiative to make an assessment
Poor training of cleansing teams and their line managers
Office staff movement from one contract to another. This can happen at most levels and many staff simply adopt measurement scales that they have used in the past rather than asking how things are done in their new role.
Relating silt measurements to invert (outlet) levels is also important, but so many networks have no accurate measurements of gully depth or invert level. Outlets can be at differing heights in the gully and when you add in the variety of differing gully pot depths across a network you can see how unreliable this data can be. When you factor for these variables, it’s no wonder that asking a gully cleaner to decide a percentage full measurement brings inaccurate assumptions.
So, what’s the solution?
Clear guidelines within an authority are an obvious fix to this but in reality, ensuring these guidelines are adhered to in the fast-paced industry where staff movement and change is constant, can be challenging.
To overcome these inconsistencies, KaarbonTech implemented a visual representation of the silt level in the Gully SMART app where the user would position the silt level in line with the outlet or grill at each inspection. Not only does this overcome these inaccuracies but it also allows for a change in classification in the future as the raw data of its position is stored in the software as well as the percentage silt using the agreed measurement scale.
Changing from 25 percentile to 10, or from percentile to CM measurement, through different years also makes data incomparable. Using the silt slider can futureproof your data by allowing a re-correlation of the measurement scale through all historic inspections if you want to change the way you work in the future.
Data quality manager at KaarbonTech, Graeme Forward said “Millions of pounds each year are spent on the basis of inspection data. Flood damage and road deaths are intrinsically linked to surface water flooding, but few Authorities appreciate the importance of good data when deciding on a software system. Although we factor more than 20 data points in our risk modelling some councils may only rely on silt levels”
The time to act is now.
Most of the industry adopts change at the end of a year, or even the end of a multi-year cleansing cycle so change can sometimes be many years away. Review and validation of data often falls in line with these change points so Local Authorities end up throwing away many years of data because they realised its unreliability too late.
If silt level is something used in your programming, then ensure you have the right education and software in place to allow you to collect accurate data.